
Running Facebook ads without measuring performance is like driving with your eyes closed. You might be going somewhere, but you have no idea if it is the right direction. This guide covers every metric, benchmark, and method you need to know if your ads are actually working and what to do when they are not.
Why measuring performance is not optional
Facebook gives you access to hundreds of data points inside Ads Manager. Most advertisers look at two reach and spend and call it a day. That is a mistake. Without the right measurements, you cannot tell the difference between an ad that is quietly profitable and one that is quietly draining your budget.
Measuring performance tells you which creatives convert, which audiences respond, which placements waste money, and where in the funnel people drop off. It turns your ad account from a guessing game into a system you can actually improve.
Set up tracking before anything else
No measurement is reliable without proper tracking in place. Before you launch any campaign, make sure these three things are set up correctly.
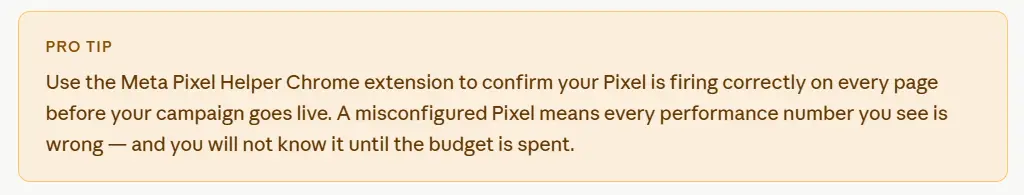
- Meta Pixel — install this on every page of your website. It tracks visitor behaviour, page views, add-to-cart events, purchases, and custom conversions. Without it, Facebook cannot tell you what happens after someone clicks your ad.
- Conversions API (CAPI) — works alongside the Pixel to send server-side data. With browsers blocking cookies more aggressively, CAPI fills in the attribution gaps that the Pixel alone misses.
- UTM parameters — add UTM tags to every ad URL so Google Analytics 4 can also track the traffic independently of Meta’s own reporting. Having two data sources makes your numbers far more reliable.
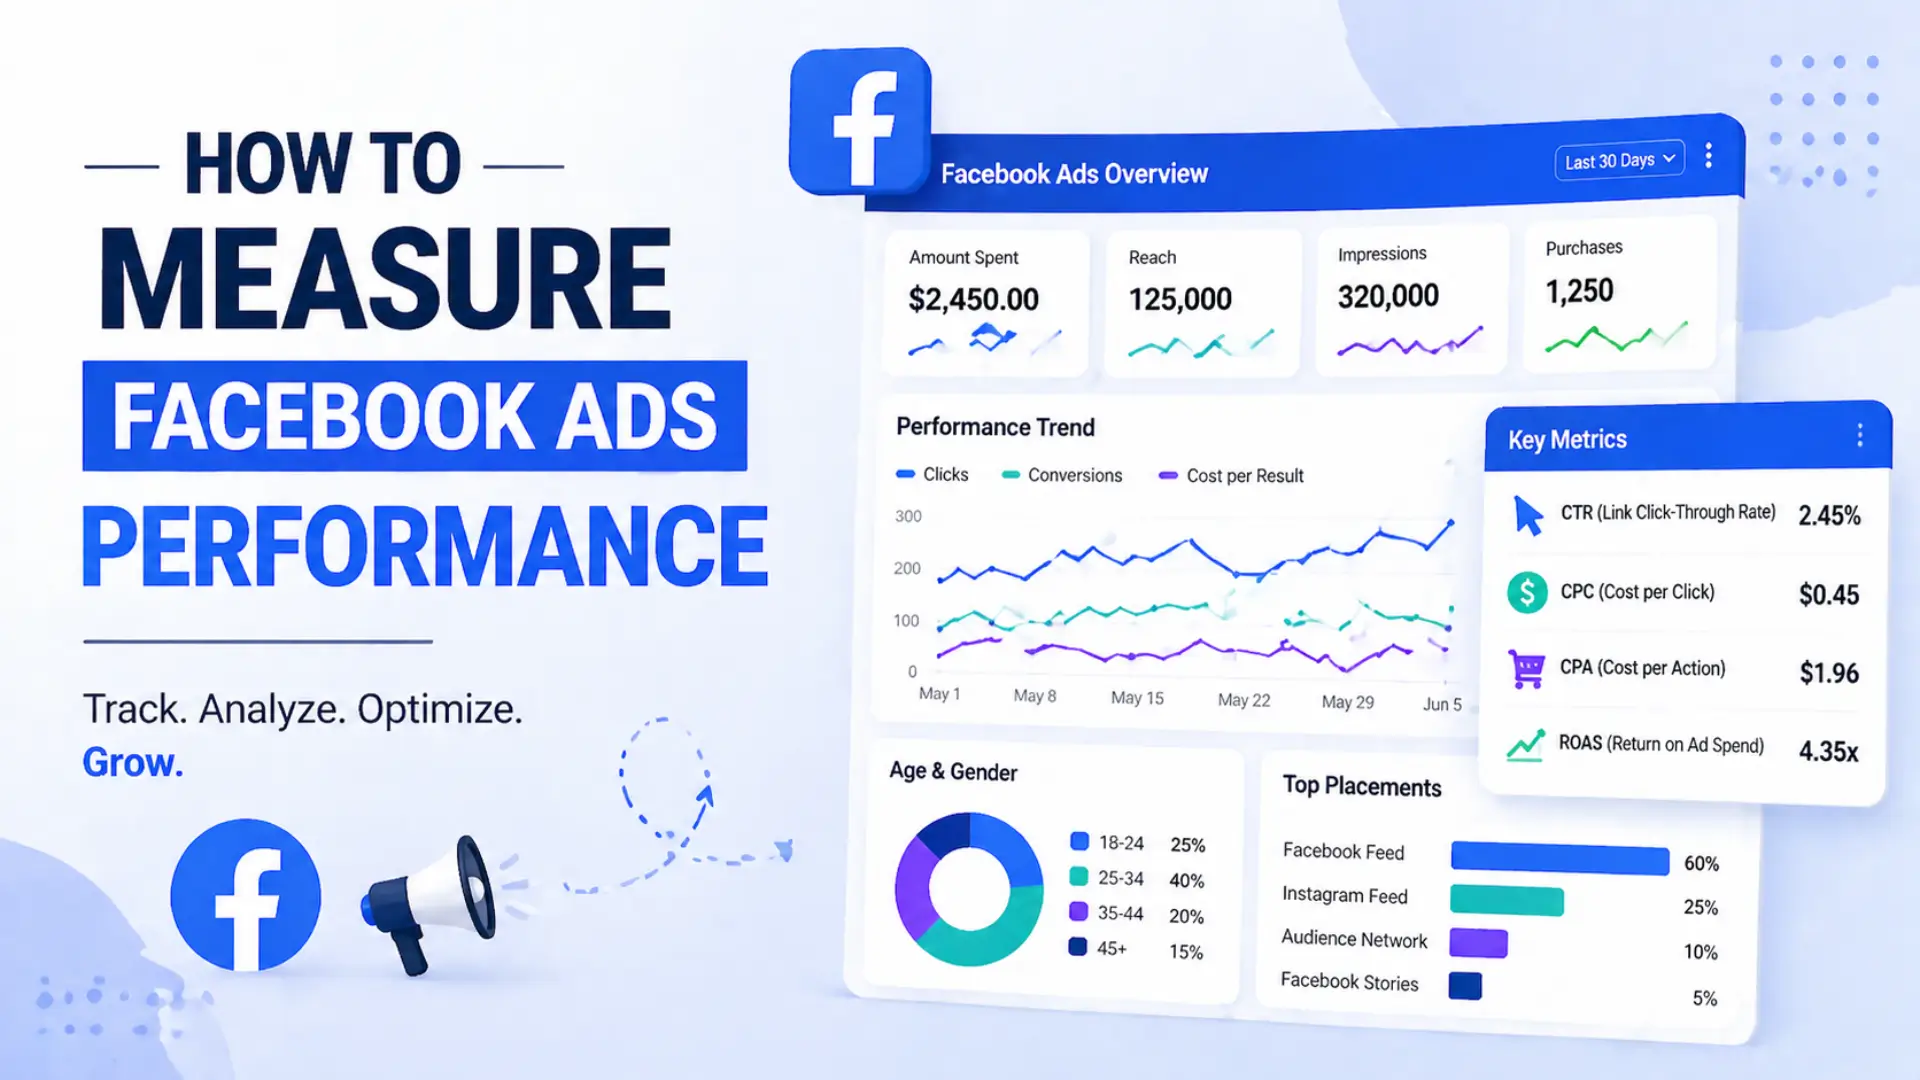
The metrics that actually matter
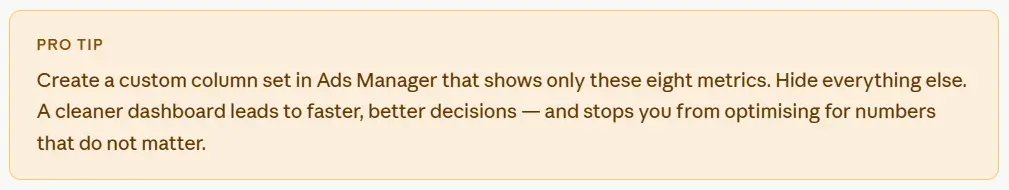
Facebook Ads Manager shows you dozens of columns. Most of them are noise. These are the ones that actually tell you something useful.
- ROAS (return on ad spend) — revenue generated divided by ad spend. This is the single most important metric for e-commerce campaigns. A ROAS of 3.0 means you made $3 for every $1 spent.
- CPA (cost per acquisition) — how much you paid for each conversion. Compare this against your profit margin on the product or service to know if the campaign is profitable.
- CTR (click-through rate) — percentage of people who clicked after seeing your ad. A low CTR means the creative or copy is not connecting with the audience. Aim for 1% or above on cold traffic.
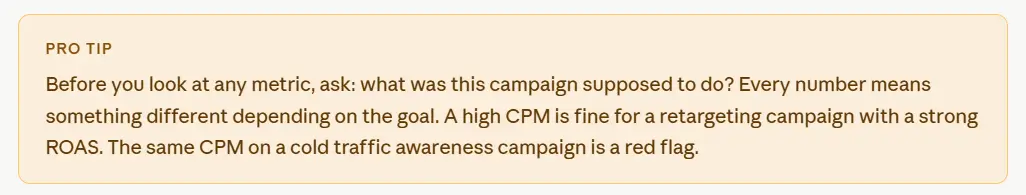
- CPM (cost per 1,000 impressions) — how much it costs to get your ad seen. CPM reflects audience competition and ad relevance. Rising CPM usually means your audience is saturated or your relevance score is dropping.
- CPC (cost per click) — how much each click costs. Useful for diagnosing problems. High CPC with low CTR points to a creative issue. High CPC with high CTR points to an audience or bidding issue.
- Frequency — average number of times each person has seen your ad. Once frequency crosses 3–4 on a cold audience, performance typically starts to drop. People stop clicking when they have seen the same ad too many times.
- Conversion rate — percentage of clicks that turned into a conversion. If your CTR is strong but conversion rate is weak, the problem is on your landing page, not in the ad.
- Reach vs impressions — reach is unique people. Impressions is total views including repeat views. A large gap between the two means your frequency is high — a sign of audience fatigue.
Key benchmarks to measure against
Raw numbers are meaningless without context. Here are realistic industry benchmarks to compare your campaigns against.
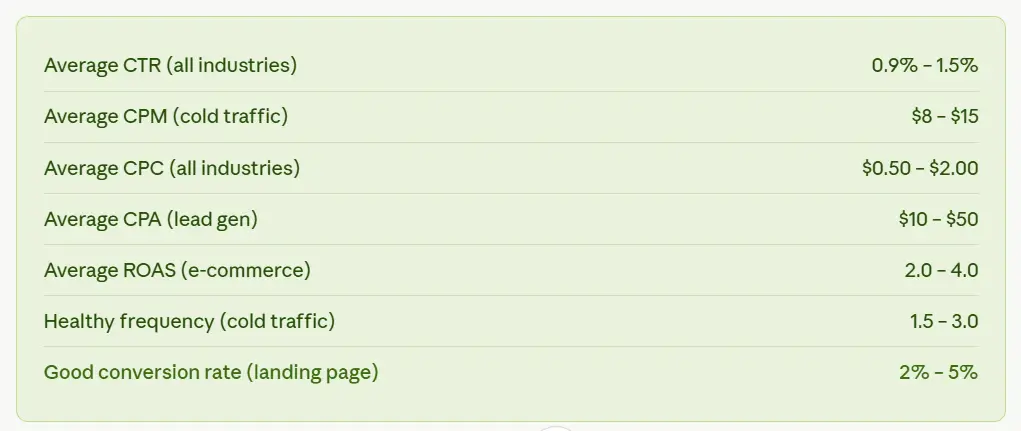
These are averages. Your numbers will vary by industry, product price, audience quality, and creative strength. Use these as a starting point, then build your own benchmarks from your historical data over time.
How to read your results at each funnel stage
Facebook ads serve different purposes at different stages of the customer journey. The metrics you prioritise should match the stage you are running at.
- Top of funnel (awareness) — focus on CPM, reach, and video view rate. At this stage you are buying attention, not conversions. Low CPM and high reach mean your budget is going far.
- Middle of funnel (consideration) — focus on CTR, CPC, and link clicks. People at this stage know you exist. The job of the ad is to get them to your site or landing page.
- Bottom of funnel (conversion) — focus on CPA, ROAS, and purchase conversion rate. This is where the money is made. If ROAS is below your break-even point, the campaign is losing money regardless of how good everything else looks.
How to diagnose a failing ad
When performance drops, most advertisers panic and turn off the campaign. A more effective approach is to diagnose exactly what is failing before making any changes.
- Low CTR — the creative or headline is not capturing attention. Test a new image, video, or opening line before anything else.
- High CTR but low conversion rate — the ad is working but the landing page is not. Check page speed, headline match, and call to action clarity.
- Rising CPA — usually caused by audience fatigue, increased competition, or creative wear-out. Check frequency first. If it is above 4, the audience has seen your ad too many times.
- High CPM with low reach — your audience is too small or too competitive. Broaden the targeting or test a new audience segment.
- Strong ROAS on paper but no actual profit — Facebook’s attribution window may be counting conversions that happened through other channels. Cross-reference with Google Analytics data before drawing conclusions.
Attribution the number most advertisers get wrong
Facebook’s default attribution window is 7-day click and 1-day view. This means it takes credit for any conversion that happened within 7 days of a click or 1 day of a view. Depending on your product’s buying cycle, this can significantly overstate or understate your actual results.
- For low-cost impulse purchases, a 1-day click window is more accurate.
- For considered purchases over $100, a 7-day or 28-day window is more realistic.
- View-through attribution counts conversions from people who saw the ad but never clicked — helpful for brand campaigns, misleading for direct response.
Always compare Facebook’s reported conversions against your Google Analytics or Shopify data. If Facebook claims 80 purchases and your store shows 50, the difference is attribution overlap — not real sales.
How often to check and report
Checking your ads too often leads to reactive decisions based on normal daily fluctuations. Checking too rarely means you miss real problems before they drain budget. Here is a simple schedule that balances both.
- Daily — spend pacing and any major anomalies. Are you spending on track? Has something suddenly stopped delivering?
- Every 3 days — CTR, CPC, and frequency. These give early warning signals before CPA starts rising.
- Weekly — full performance review. ROAS, CPA, conversion rate, and audience insights. This is where you make budget and creative decisions.
- Monthly — strategic review. Compare campaigns, audiences, and creatives against each other. Identify what to scale, pause, or test next.
Measuring creative performance
The creative image, video, or carousel is usually the biggest driver of ad performance. Facebook’s built-in tools make it straightforward to measure which creative is actually winning.
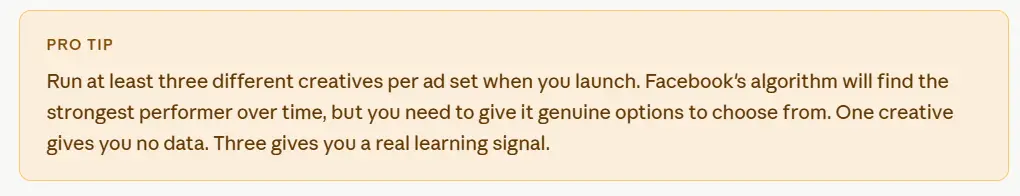
- A/B testing — Facebook’s native split testing tool runs two versions of an ad against each other with statistical confidence. Use it to test one variable at a time: headline, image, or call to action.
- Breakdown by placement — the same creative can perform very differently in Feed vs Stories vs Reels. Break down your results by placement to see where each format is strongest.
- Hook rate — for video ads, check the percentage of viewers who watch past the first 3 seconds. A low hook rate means the opening is not stopping the scroll. The rest of the video does not matter if nobody gets that far.
- Thumbstop ratio — impressions divided by 3-second video views. A ratio above 30% is considered strong. Below 15% means the creative needs rethinking from the very first frame.
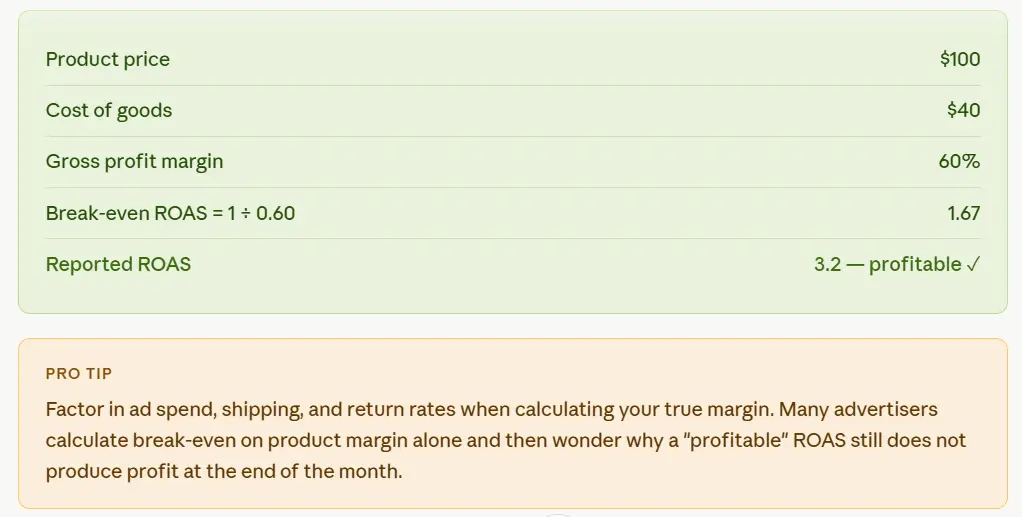
Calculate your break-even ROAS
Before you can say a campaign is profitable, you need to know the minimum ROAS at which you break even. Here is the formula.

If your profit margin is 40%, your break-even ROAS is 1 ÷ 0.40 = 2.5. Any campaign below 2.5 ROAS is losing money. Any campaign above it is profitable. This one number changes how you read every ROAS figure in your account.
Tools to measure Facebook ads performance
- Meta Ads Manager — the primary dashboard for all campaign data. Use custom columns, breakdowns, and the attribution settings to get accurate readings.
- Google Analytics 4 — cross-reference Facebook’s reported traffic and conversions against an independent source. Essential for catching attribution inflation.
- Meta Pixel + Conversions API — the foundation of accurate event tracking. Both should be running together for reliable data.
- Shopify / WooCommerce dashboards — compare store-side purchase data against what Facebook reports to identify discrepancies.
- Triple Whale / Northbeam — third-party attribution tools that give a platform-neutral view of which channels are actually driving conversions across your entire media mix.
- Social Media ROI Calculator — socialmediaroicalculator.com — calculate the overall ROI of your Facebook campaigns alongside other channels. Free and no sign-up needed.
The bottom line
Measuring Facebook ads performance is not about watching numbers it is about asking the right questions of the right data at the right time. Know your goal, track the metrics that match it, compare against realistic benchmarks, and diagnose problems methodically before changing anything.
The advertisers who win on Facebook are not the ones with the biggest budgets. They are the ones who read their data better than everyone else.
Want to measure the overall ROI of your Facebook campaigns? Try the free calculator at socialmediaroicalculator.com →